Sisy Wong
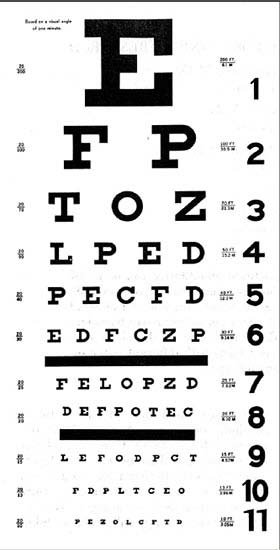
Snellen eye chart is a chart that measures visual acuity by determined the visual level of different sizes of characters. It was invented in 1862 by a Dutch ophthalmologist called Herman Snellen. The Snellen eye chart is something where you can often see in the hospital or in physician and optometrist offices. It has 11 lines of block letters, which also called “optotypes”. Besides, they are constructed according to geometric rules and the size of the blocks is decreasing on each lower line of the chart.
In a common Snellen eye chart, it always starts with a letter “E” and following by other 9 letters: “C”, “D”, “E”, “F”, “L”, “O”, “P”, “T” and “Z”. The right way to test the visual acuity is to stand 20 feet away from the eye chart and read each line of the chart by using only one eye. Each line of the eye chart assigned a ratio of visual acuity and for a normal vision is 20/20 in the US. In some metric system countries, the normal vision is 6/6. The ratio that is less than 1 is assigned a worse sight and greater than 1 is assigned a better sight.
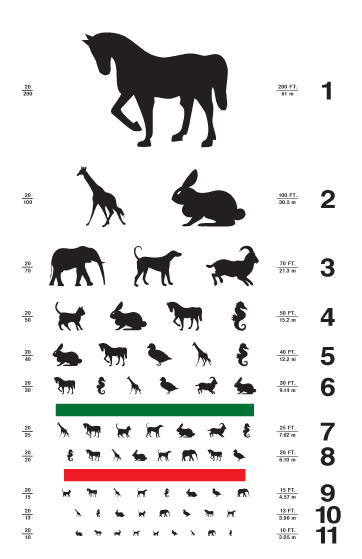
There are lots of different styles of the eye chart, like the one on the left-hand side, it’s a kids’ eye chart that using animal logos instead of the blocks to make children feeling interested in being an eye test. In my opinion, different styles of eye charts are making “eye chart” become interesting. However, in most of the block eye charts are using different letters, so people criticize that it’s not fair as different letters have different difficulties. Thus, the eye chart that uses for an eye test has changed into all letter “E” with different rotations.

Resource: https://www.britannica.com/science/Snellen-chart